Background
The conceptual components of qcodes are:
Drivers for setting and reading parameters from instruments
A framework for the storage and organization of data
Loops, i.e. step-wise increment an independent parameter (e.g. a voltage)
Plotting tools for data visualisation
This means that one can vary an independent parameter, measure all dependent parameters, store these data in a well-organised format, and visualise them. This is pretty much all one ever does in science.
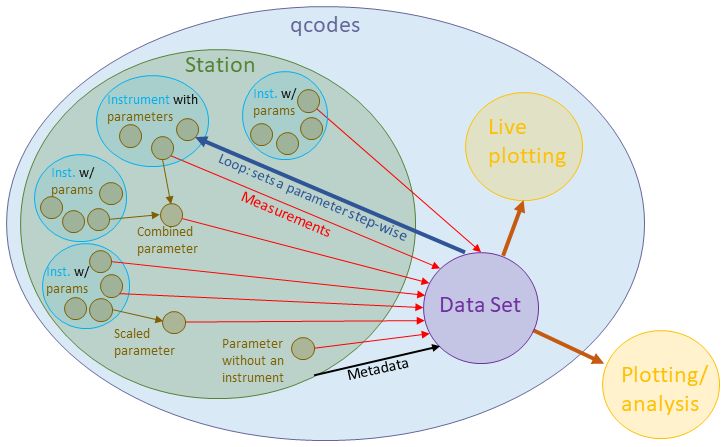
The above graphic gives a rough conceptualisation of qcodes++ structure.
The Station contains Instruments, which each contain various Parameters that can be measured and/or set.
Parameters can be scaled, combined, and defined without instruments (e.g. time).
The Data Set defines the independent parameter’s setpoints as a Loop
Running a Loop collects measurements of the desired dependent parameters.
Station also sends important metadata to the DataSet including the value of every Parameter from every Instrument at the start of the Loop, whether that Parameter was measured at each setpoint of the Loop or not.
In addition to the Loop, qcodes++ also has Measure, which simply measures a set of parameters at a single point in time, without looping.
Two options for plotting are available: live plotting, which is so lightweight and fast that it can likely refresh as fast as you can measure without affecting performance, and offline plotting, in which more complex analysis is possible; e.g. curve fitting, linecuts of 2D data, taking derivatives, etc.
The features of qcodes++ are mostly either directly inherited from the latest version of QCoDeS, or are
improved versions of features that were present in QCoDeS prior to version 0.11. In particular, qcodes++
uses the text-based DataSetPP, which although much less flexible than the QCoDeS DataSet, is much more
user-friendly, especially when combined with the Loop and Measure classes. And indeed the limitations
imposed by the DataSetPP enables the plotting capabilities, which far outstrip those of QCoDeS.
In short; if you want a user-friendly way to collect and plot data, use qcodes++. If you need something highly customisable, use QCoDeS. The good news; installing qcodes++ does not interfere with a QCoDeS installation, and in fact requires it; this means you can use the best of both worlds! See here for a more detailed comparison.